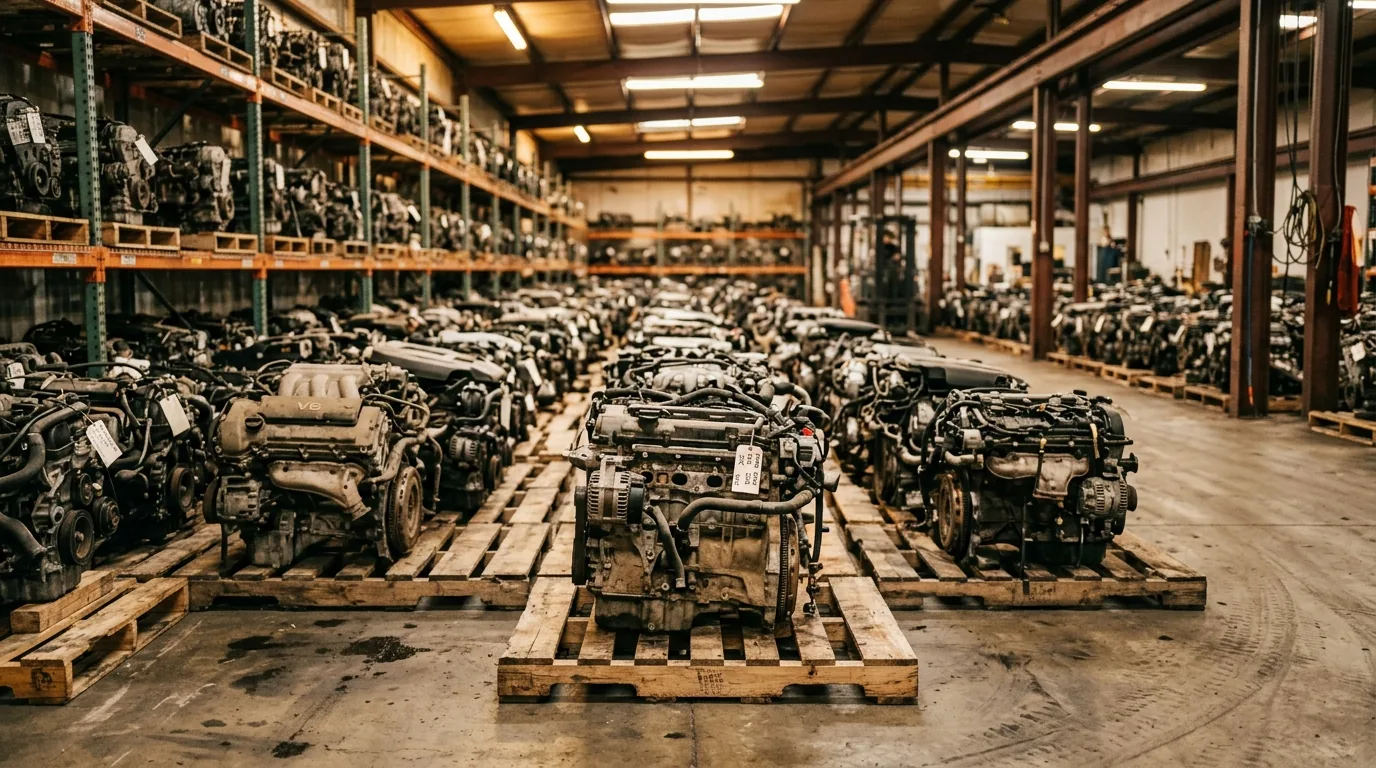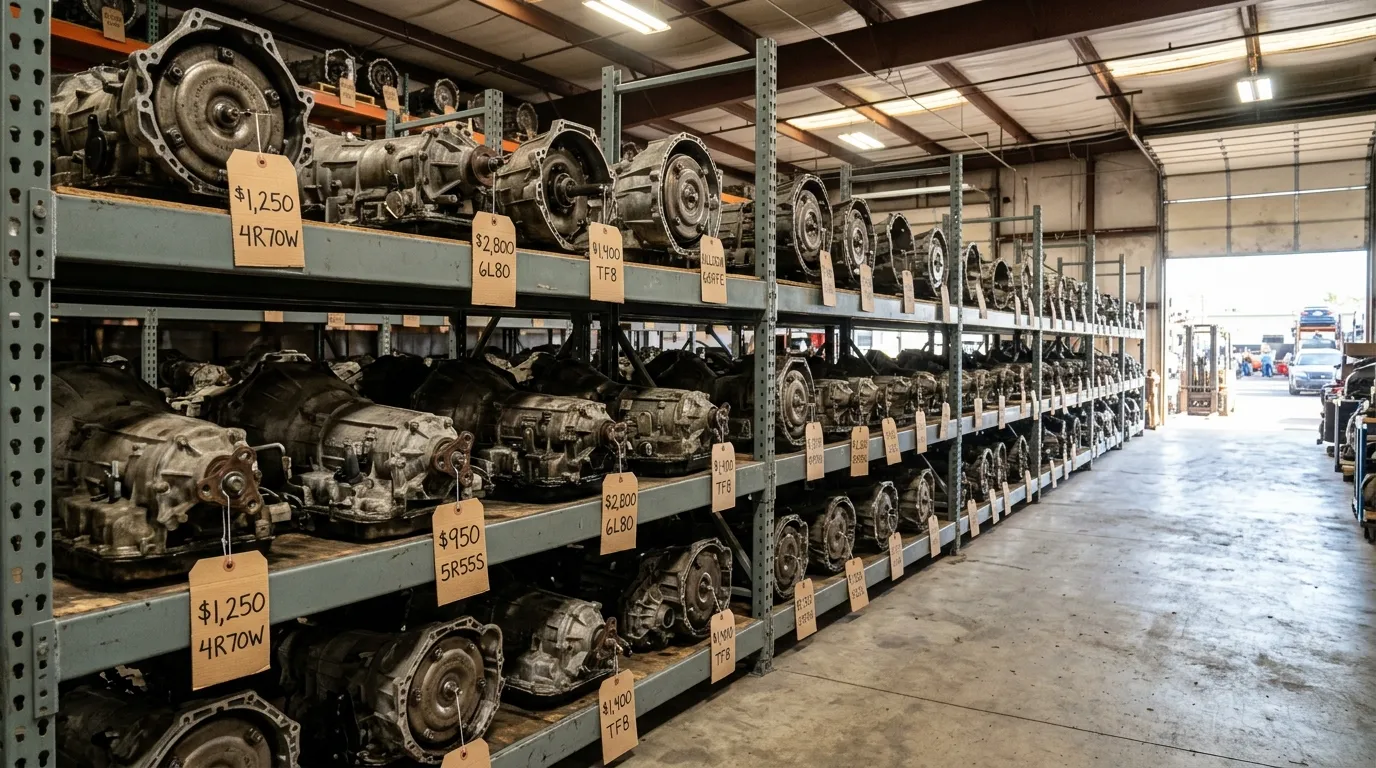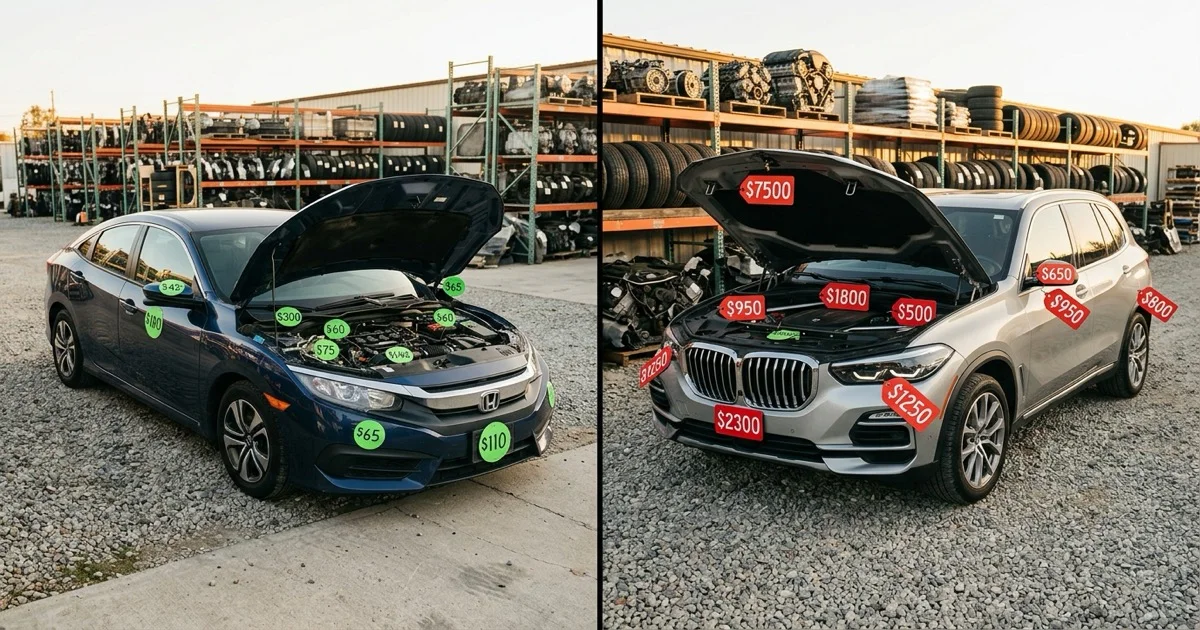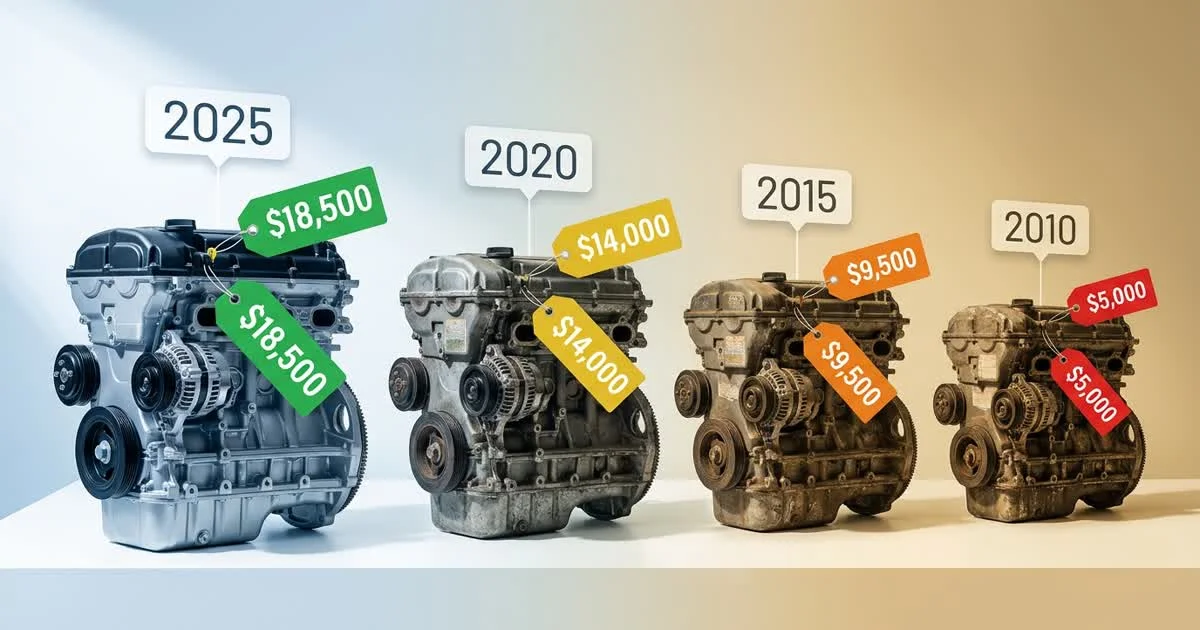
Used parts from 2015 model year vehicles cost 30-50% less than equivalent parts from 2024 models, with the steepest depreciation on engines and transmissions. This analysis covers year-by-year pricing across five major part categories, using PartPriceGuide's salvage yard data spanning model years 2015 through 2025.
The value sweet spot sits in the 7-10 year old range (2016-2019 model years), where parts are 20-35% cheaper than current-year equivalents while still offering abundant supply and reasonable remaining service life.
- Engines depreciate 47% from 2025 ($3,356 avg) to 2015 ($1,788 avg) across all models
- Transmissions depreciate 44% from 2025 ($2,171 avg) to 2015 ($1,210 avg)
- Headlights depreciate 53% from 2025 ($790 avg) to 2015 ($368 avg)
- Bumper covers and radiators show gentler curves at 22% and 42% respectively
- The 2016-2019 sweet spot balances lower prices with strong salvage yard availability
The Big Picture: Older Parts Cost Less
Every part category in our analysis follows the same pattern: newer model year parts cost more, and the price drops as the model year gets older. The rate of depreciation varies a lot by part type, though.
Here's how the average median price changes from model year 2025 to 2015 across five major categories:
| Part Category | 2025 Avg Median | 2015 Avg Median | Depreciation |
|---|---|---|---|
| Engine | $3,356 | $1,788 | 47% |
| Transmission | $2,171 | $1,210 | 44% |
| Headlight Assembly | $790 | $368 | 53% |
| Radiator | $247 | $142 | 42% |
| Front Bumper Cover | $317 | $247 | 22% |
Front bumper covers have the flattest curve. Bumper pricing is driven mostly by paint condition and physical damage rather than age or technology. A 2015 bumper in good condition is worth nearly as much as a 2023 bumper in the same shape.
Engine Price Depreciation by Year
Engines are the highest-value used parts, and they follow one of the clearest depreciation curves:
| Model Year | Avg Median Price | Models Sampled | vs 2024 |
|---|---|---|---|
| 2025 | $3,356 | 61 | +15% |
| 2024 | $2,914 | 66 | — |
| 2023 | $2,816 | 69 | -3% |
| 2022 | $2,687 | 67 | -8% |
| 2021 | $2,866 | 72 | -2% |
| 2020 | $2,658 | 64 | -9% |
| 2019 | $2,543 | 68 | -13% |
| 2018 | $2,453 | 67 | -16% |
| 2017 | $1,990 | 27 | -32% |
| 2016 | $2,124 | 26 | -27% |
| 2015 | $1,788 | 29 | -39% |
The steepest drop hits between 2019 and 2017 model years, where average engine prices fall from $2,543 to $1,990, a 22% decline in just two model years. That lines up with the 5-7 year point when vehicles start entering salvage yards in larger numbers after lease returns and aging out of warranty coverage.
For engine pricing by specific model, see our used engine cost guide with pricing across 48 vehicle models.
Transmission Price Depreciation by Year
Transmissions follow a similar curve to engines but with a slightly gentler slope:
| Model Year | Avg Median Price | Models Sampled | vs 2024 |
|---|---|---|---|
| 2025 | $2,171 | 56 | +22% |
| 2024 | $1,782 | 63 | — |
| 2023 | $1,648 | 66 | -8% |
| 2022 | $1,542 | 73 | -13% |
| 2021 | $1,487 | 64 | -17% |
| 2020 | $1,486 | 76 | -17% |
| 2019 | $1,495 | 70 | -16% |
| 2018 | $1,452 | 66 | -19% |
| 2017 | $1,346 | 27 | -24% |
| 2016 | $1,278 | 28 | -28% |
| 2015 | $1,210 | 30 | -32% |
For transmission pricing by model, see our used transmission cost analysis.
Body Parts: Headlights, Bumpers, and Radiators
Body and cooling parts depreciate differently from drivetrain components:
Headlight Assemblies
| Model Year | Avg Median Price | Models Sampled |
|---|---|---|
| 2025 | $790 | 65 |
| 2024 | $782 | 67 |
| 2023 | $703 | 71 |
| 2022 | $713 | 74 |
| 2021 | $670 | 64 |
| 2020 | $586 | 69 |
| 2019 | $548 | 72 |
| 2018 | $502 | 69 |
| 2017 | $446 | 28 |
| 2016 | $432 | 27 |
| 2015 | $368 | 26 |
Front Bumper Covers
| Model Year | Avg Median Price | Models Sampled |
|---|---|---|
| 2025 | $317 | 65 |
| 2024 | $307 | 63 |
| 2023 | $301 | 69 |
| 2020 | $273 | 69 |
| 2018 | $266 | 65 |
| 2015 | $247 | 27 |
Radiators
| Model Year | Avg Median Price | Models Sampled |
|---|---|---|
| 2025 | $247 | 63 |
| 2024 | $250 | 64 |
| 2023 | $224 | 72 |
| 2021 | $198 | 71 |
| 2019 | $163 | 69 |
| 2017 | $135 | 33 |
| 2015 | $142 | 26 |
The Value Sweet Spot: 7-10 Year Old Parts
Based on the data across all five categories, model years 2016-2019 represent the best value for used parts buyers. Here's why:
Sufficient depreciation. Parts from this range are 20-35% cheaper than 2024 equivalents across most categories. That is enough savings to be meaningful on high-value parts like engines and transmissions.
Strong supply. Vehicles from 2016-2019 are now 7-10 years old, the age when lease returns have fully cycled, out-of-warranty repairs become uneconomical, and collision totals become more common. Salvage yards are well-stocked with these model years.
Compatibility. Parts from this range typically fit current-generation vehicles since most manufacturers run model cycles of 5-8 years. A 2018 part often fits vehicles from 2015 through 2023 or later.
Diminishing returns beyond 10 years. Going from a 2019 part to a 2015 part saves an additional 10-15% but introduces higher fitment risk (potential generation changes) and lower remaining service life. The marginal savings often aren't worth the added uncertainty.
When Older Parts Do Not Save Money
Several scenarios break the "older is cheaper" pattern:
Discontinued models. When a model stops production, salvage supply eventually dries up, and remaining parts command premiums. A 2015 part for a discontinued model may cost more than a 2020 part for a current-production vehicle.
Generation transitions. If a vehicle was redesigned between model years, parts from the old generation don't fit the new one. This splits the market and can push prices up on both sides of the transition because of smaller compatibility pools.
Desirable classic trucks and SUVs. Vehicles with cult followings (certain Toyota trucks, Jeep Wranglers) maintain or increase parts values as they age because demand remains strong while supply diminishes.
Year-Based Buying Strategy
When shopping for used parts, use model year as a lever alongside part condition grade and brand selection:
For engines and transmissions ($1,000+): Target 2017-2019 model years for the best balance of savings (25-35%) and remaining life. A 2018 Grade B engine delivers similar savings to a current-year Grade C engine but with lower mileage.
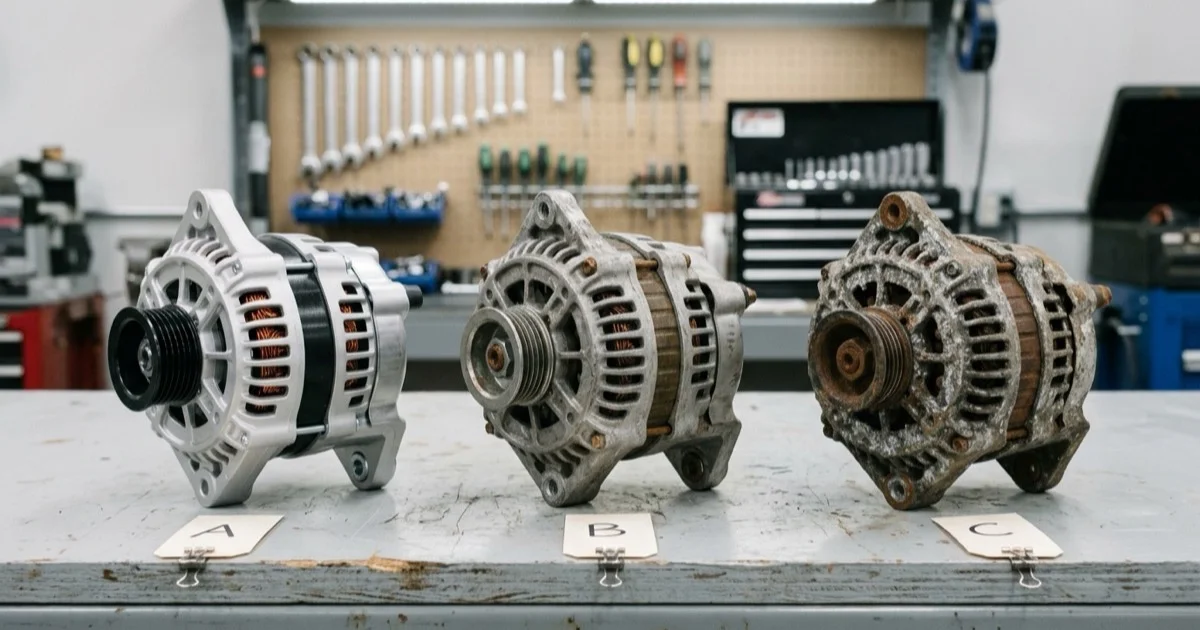
For headlights and body panels ($200-800): Model year matters less than physical condition. A 2016 headlight in excellent condition beats a 2023 unit with scratched lenses.
For commodity parts under $200: Year barely matters. Buy whatever's available in good condition with a warranty.
For model-level pricing that accounts for both brand and year, see our full cost-of-ownership rankings covering 90 vehicles.